A Possible Debt of New Heights
As the U.S. government debates a $3.5 trillion stimulus package this month, Scott Morrison shares his thoughts on government debt, labour shortages, and inflation as well as how economies of other countries like Japan and China, are faring.
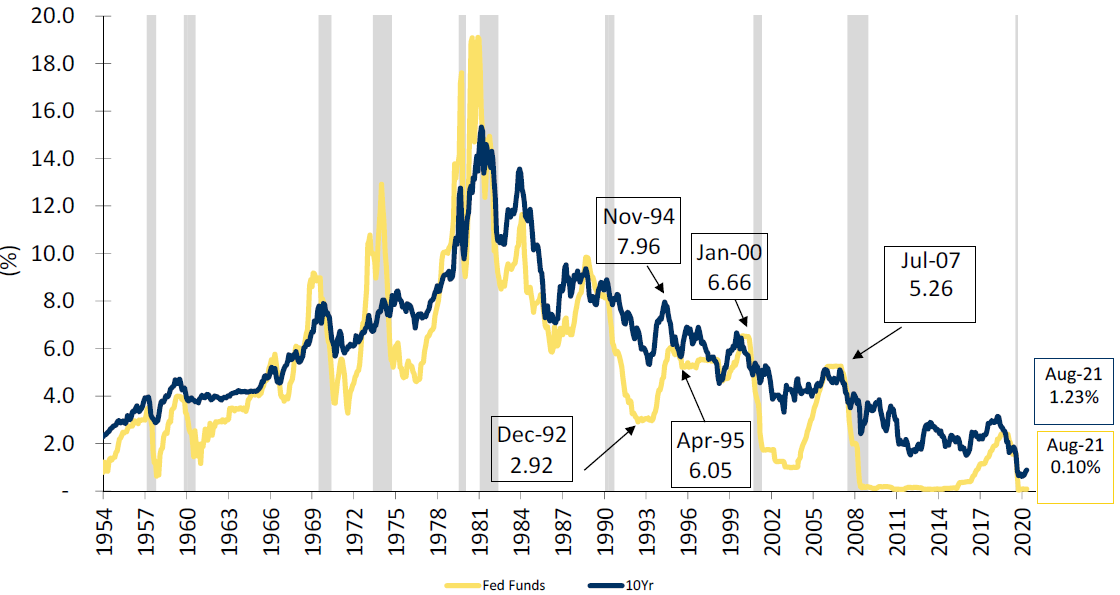
As the economy recovers and in certain sectors soar from the depth of the pandemic in 2020, the highly contagious Delta variant is causing economic anxiety to rise around the world. This economic rebound is unlike any I have seen in my 25-year career. In so many ways this recovery has been quicker and stronger than I have ever experienced. Yet, interest rates remain incredibly low as you can see in the below chart that illustrates the 40-year bull-market in bonds and fed funds rate at near zero. The second chart shows a global view of sovereign debt with negative yields in red. WOW! I personally believe the U.S. Fed will soon be forced to remove its very aggressive and extraordinarily loose monetary approach.
FED FUNDS RATE AND 10-YEAR TREASURY RATE
Multi-Decade Bull Market in U.S. Government Bonds – Can it be Sustained?

GLOBAL SOVEREIGN INTEREST RATES
While I write these comments, politicians in the States are debating a desired $3.5 trillion stimulus package while in one month from now, they will be debating raising the debt ceiling since the U.S. government is essentially running out of money – again! But, why should a politician worry about running out of money when your central bank is systematically monetizing your debt? I read with interest a quote on CNBC from Janet Yellen in her testimony to congress that said: “A delay that calls into question the federal government’s ability to meet all its obligations would likely cause irreparable damage to the U.S. economy and global financial markets.” Since the Democrats control both the Senate and Congress, capital markets are pretty much assuming these debates are “much ado about nothing.”
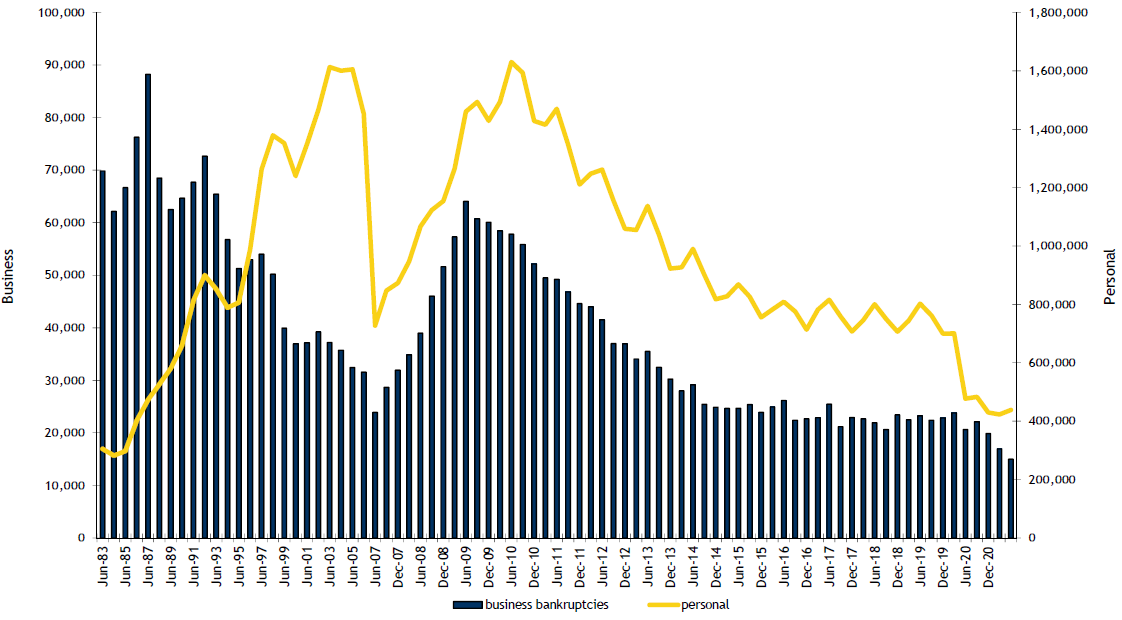
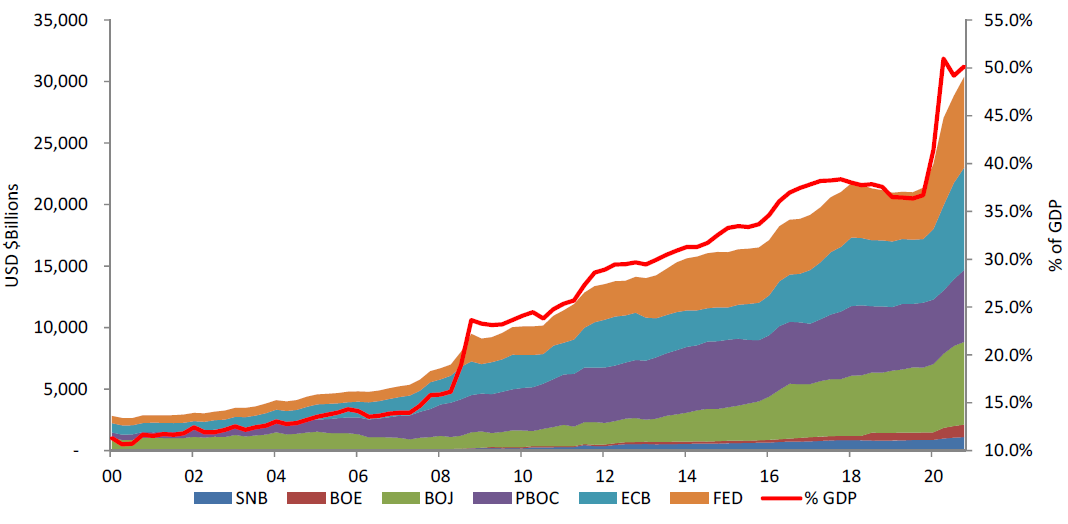
It may serve as a useful reminder to recall that Janet Yellen is an U.S. ex-central bank chief. She was the predecessor to the current chairman of the U.S. federal reserve Jerome Powell. Recall, that Janet Yellen was pushed out of her post by President Trump and replaced by Jerome Powell whom Trump on several occasions tweeted was not doing a good job by tightening monetary conditions in 2017 and 2018 and not doing enough to help the U.S. economy. As you look at the chart below, you can see that Jerome Powell must have gotten the message because the Fed’s balance sheet is growing at an astronomical rate. Recall that as I have written before, I started Panorama Fund in 2008 in part on the thesis that I thought the world had too much debt. For over 15 years, I was concerned that debt was being increased at a higher rate than tax revenues by governments around the world. I did not anticipate a world where debt would almost go parabolic, and bankruptcies would go down during a crisis/recession.
WEEKLY BANKRUPTCY FILINGS
Note : Spike from *rush-to-file” in 4Q05
BANKRUPTCY STATISTICS – ANNUAL BUSINESS & PERSONAL BANKRUPTCIES (1983-2Q21)
Business Bankruptcies Expected to Accelerate
As a result of the willingness of central banks and governments to bail out those in trouble during the past financial crises, I have growing concerns that we are conditioning corporate citizens to become complacent about taking on debt. You can see in the below chart that corporate America has become very open to adding leverage since before Covid. It makes me feel like we are at an almost “All You Can Borrow Debt Buffet.” Thus, if interest rates were to ever rise faster than anticipated, there is a scenario where there will be some major financial accidents and market volatility unless the government steps in to bail us out, again and again.
AGGREGATE BALANCE SHEET OF LARGE CENTRAL BANKS
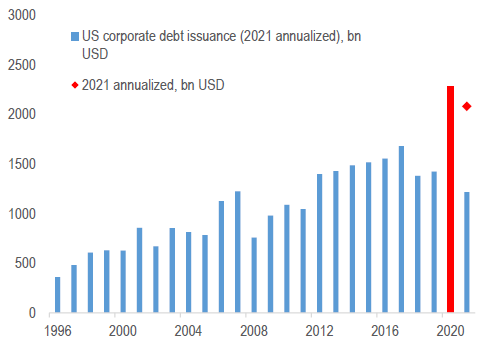
I am a big believer in the laws of gravity and the general principles behind supply and demand. Typically, if you increase the supply of something, the price should go down – unless of course, demand exceeds supply growth. As you can see below, corporate debt issuance is at near all-time highs and yet price spreads are near all-time lows. The only rational explanation to me is that the actions of the global central banks is forcing money to flow to these new issuances. As illustrated below, from a global standpoint, the U.S. appears most aggressive. This is why we are allocating more assets to areas where debt is less extended. Our colleague Andrew Labbad and the Amplus Credit Income Fund are very well- positioned to profit from this powerful trend.
ISSUANCE IS CLOSE TO ALL-TIME HIGHS
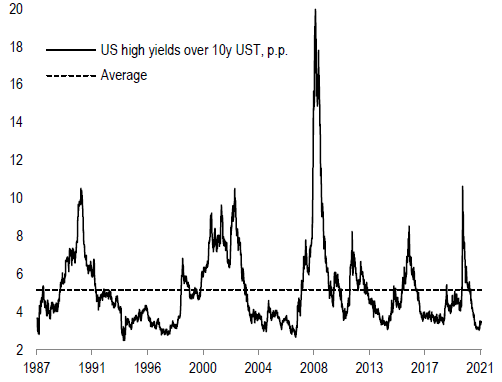
CREDIT SPREADS ARE CLOSE TO THEIR ALL-TIME LOWS
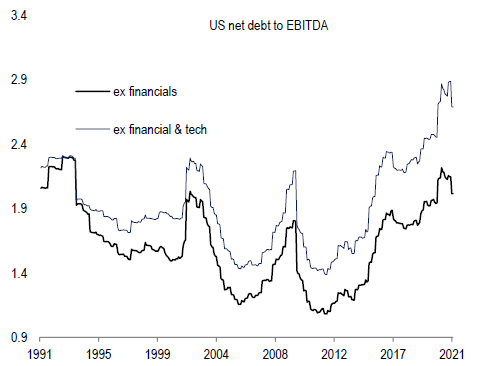
NET DEBT TO EBITDA IS HIGH IN THE U.S.

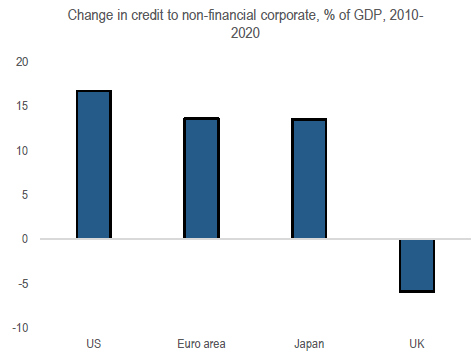
U.S. SEEN THE BIGGEST INCREASE IN CORPORATE LEVERAGE IN THE PAST 10 YEARS
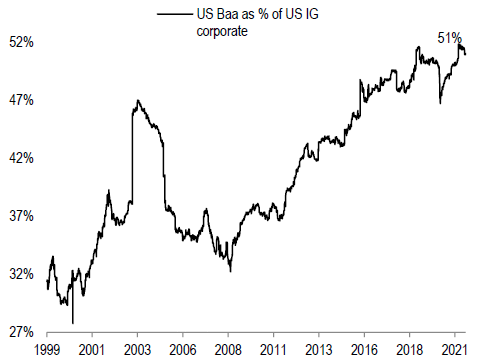
NEAR-RECORD LEVEL OF INVESTMENT GRADE DEBT IS JUST ONE GRADE ABOVE JUNK

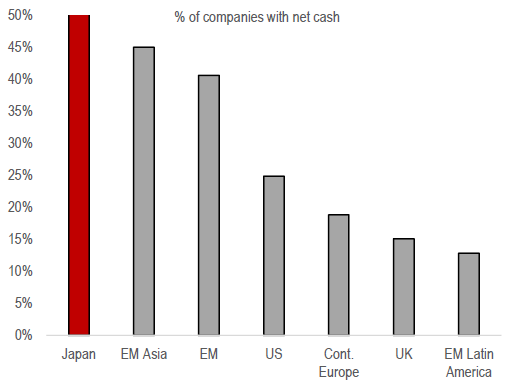
I would be remiss if I did not update you on some inflation insights we are getting from our regular discussions with management teams from around the world. One interesting conversation we had was with the CFO of Subaru from Japan. At present, they are seeing cost pressures as result of Covid and staff shortages. As well, they are experiencing semi-conductor shortages which is benefitting some of our semiconductor holdings that supply the auto sector. As such, the stock is in the doldrums because they cannot meet demand by consumers who in part, thanks to low interest rates, want to buy their cars. Autos are in demand partly because of people’s hesitancy to travel by public transit during Covid. One data point that is crucial to our choice to invest in Subaru as a contrarian is that they are currently running their plants at only 80% of capacity. Subaru has over $6 billion in net cash on its balance sheet with a market capitalization of $18 billion. We believe a lot of bad news is priced into this stock and as they re-ramp their capacity in years to come, they could easily grow free cash flow and earnings in the double digits as Subaru takes market share in Canada and the U.S. from 3 to 4% respectively to its target of 5%. As a result, we believe the company will generate over a 10% free cash flow yield in the next 12 to 18 months — very attractive yield in today’s low-rate world. Subaru is an example of why you are seeing our weighting in Japanese businesses go higher. As you can see in the below chart, Japan is a geography with many companies with clean balance sheets that can use that cash to weather any storms ahead, buy back stock and grow their dividends.
JAPAN HAS THE LARGEST % OF COMPANIES WITH NET CASH
DO YOU FEAR THAT YOU COULD DIE AS A RESULT OF CONTRACTING COVID-19?
Percentage of Respondents Who Fear Death as a Result of Contracting COVID-19
JAPAN LOOKS CHEAP ON A P/E BASIS

THE U.S. HAS THE HIGHEST MARKET CAP TO SALES RATION OF ANY MAJOR REGION
(A PROXY ON DURATION)
One fascinating conversation we had on inflationary pressures was with the investor relations team of Lamb Weston. Lamb Weston is the largest frozen potato supplier in the world. The company missed their quarterly results in August and saw their shares drop as earnings missed expectations due to pricing pressures from shipping and freight costs and staffing shortages. The company needs 5,000 employees to run their processing plants and at present, they are short 500 staff which is obviously impacting efficiencies. One of the problems is that only 40% of their staff is vaccinated and as a result, they are seeing high absenteeism and hesitancy for some to want to work beside others who are not vaccinated. We will closely monitor their success in turning this problem around since it is a great leading franchise and they told us they will be passing along these cost pressures through price increases to their customers. And as we read on Yahoo finance this month: “the annual inflation rate is now up to 5%, and food prices for food eaten away from home has jumped 4% compared with one year ago. This is the largest 12-month increase since October 2008, right before the great recession.” If these price increases are not temporary, then many central bankers will have a problem saying these costs are simply transitory and will have to move rates higher.
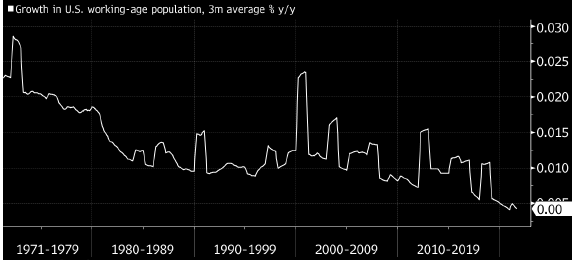
I found the below chart fascinating since it has potential huge ramifications for go-forward inflation the central banks and politicians may be underestimating. It shows that the growth in working age population is slowing materially. When you combine this with the increase in retirement trends we talked about in previous comments, then we should not be surprised to see the risk of labour shortages in the charts that follow. And once again if supply is low and demand is high, then one should expect wages to rise. This is a real risk to Central Bank’s current easy monetary policy. Hence, we will avoid the equity of overly levered companies.
GROWTH IN WORKING-AGE POPULATION HAS SLOWED TO A CRAWL
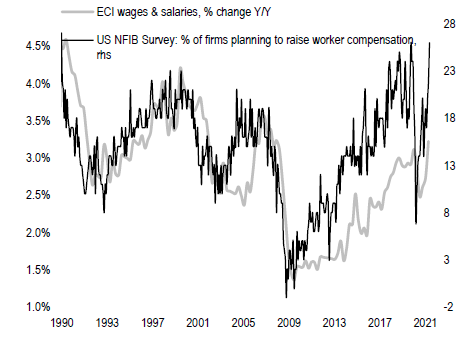
WAGE GROWTH AND NFIB SURVEY ARE BOTH UP SHARPLY
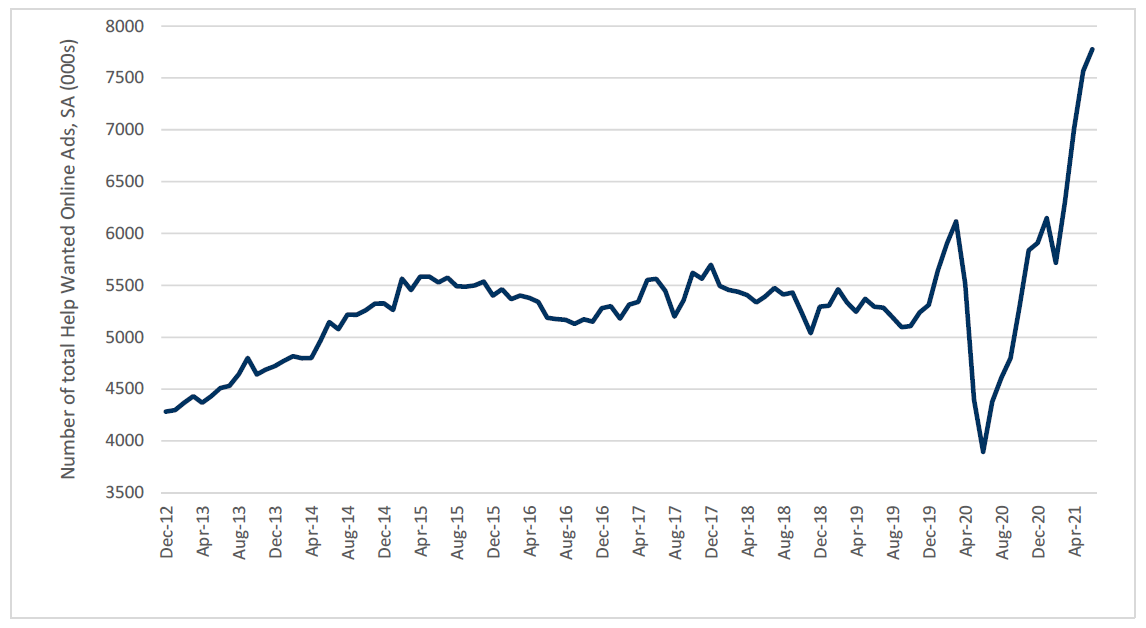
ONLINE HELP WANTED ADS
Number of Total Online Help Wanted Ads – Strong Rebound since COVID-19 Collapse
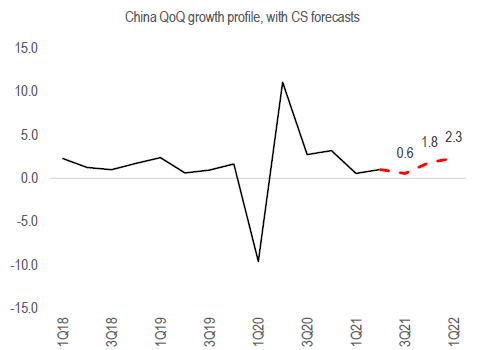
Another risk we are researching is the soon-to-be number one economy China slowing down more than anticipated. In particular, I am watching with interest one of China’s largest real estate developers face bankruptcy after China tightened monetary policy into late last year as inflation pressures rose in China. Evergrande’s stock has gone from $25 Hong Kong dollars to $2 in the last year. This is one past short we wish we had never covered. Stay tuned on how China handles this as over 70,000 Chinese home buyers’ deposits could go up in smoke. This we believe will force China to loosen monetary policy again soon and present more buying opportunities for leading Chinese franchises. Stay tuned for what we are looking to buy for the fund.
CHINA GDP GROWTH QUARTER ON QUARTER AT A LOW
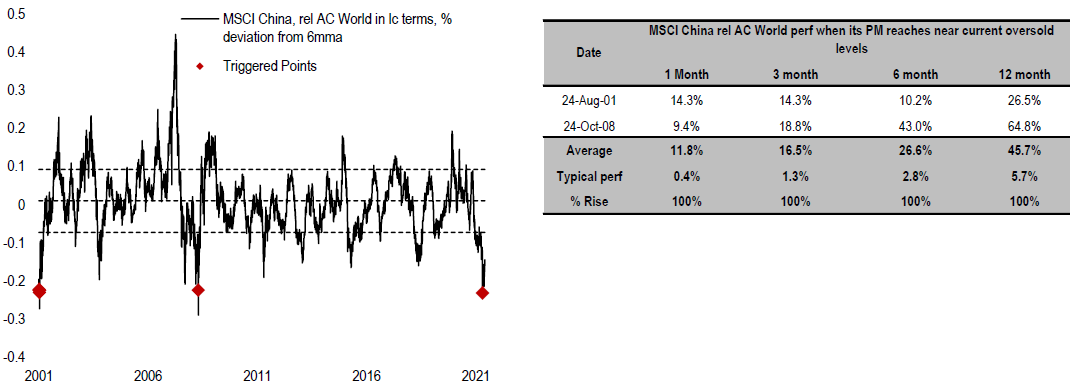
MSCI CHINA IS VERY OVERSOLD… …AND HAS USUALLY BOUNCED BACK FROM THESE LEVELS
Despite all my discussion around interest rates potentially being too low, there are some very positive second derivative impacts of low interest rates and our investment opportunity set at Wealhouse. Namely, as shown in charts below, the majority of U.S. consumers have seen their financial positions improve post-Covid. If you have had a job and owned a house, you have seen your fiscal situation blossom. This bodes well for our select holdings levered to consumer spending such as Dick’s Sporting Goods, Gildan, Masco, Lennar, Sonos, Sony, Walt Disney and Vail. We leave with you a positive quote from the Value Line Investment Survey we subscribe to: “Americans are opening up their wallets with personal expenditures climbing 11.8% in the second quarter. All told consumer spending accounted for a solid 69% of total activity in the period. The latest quarterly increase in GDP also enabled the economy to surpass its pre-pandemic level in only a year.”
HOUSEHOLD DEBT SERVICE AS PERCENTAGE OF DPI
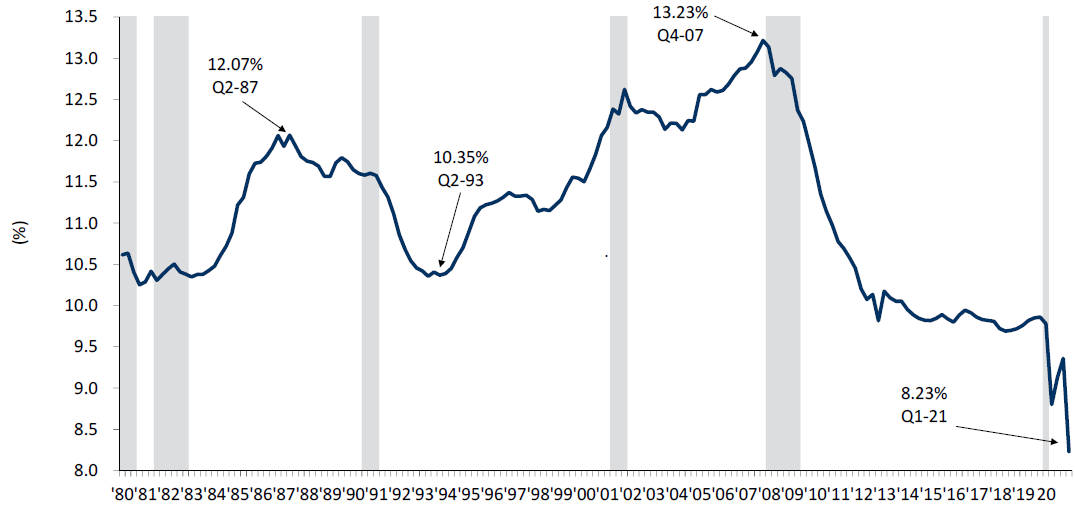
Note: The household debt service burden is an estimate of the ratio of debt payments to disposable personal income. Debt payments consist of the estimated required payments on outstanding mortgage and consumer debt.
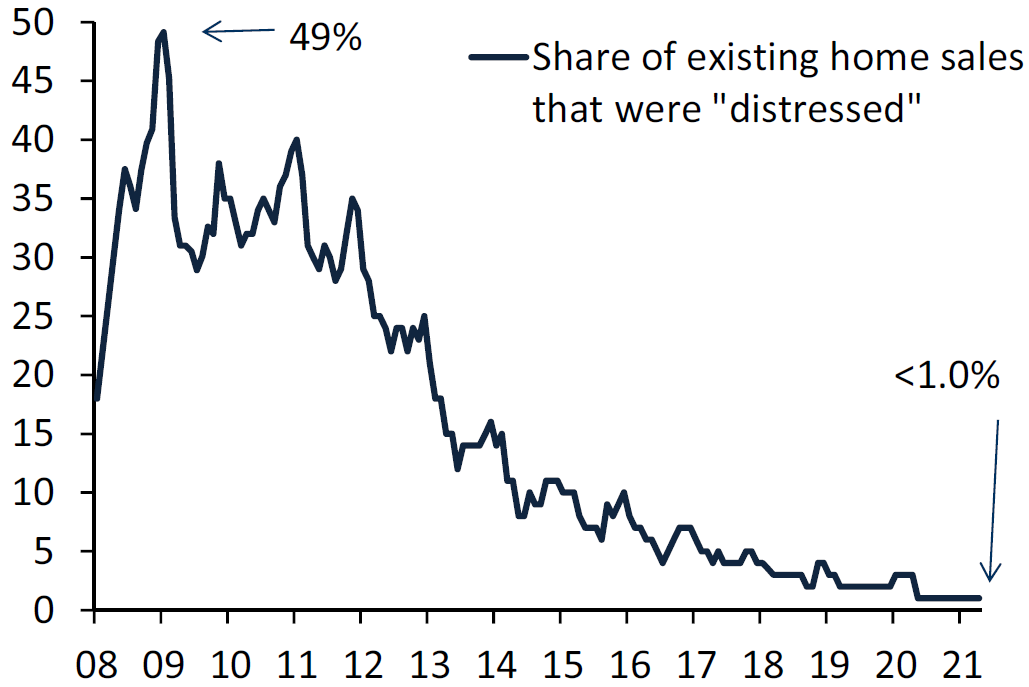
HOUSING
Percentage of Existing Home Sales that Were “Distressed” at a Multi-Year Low
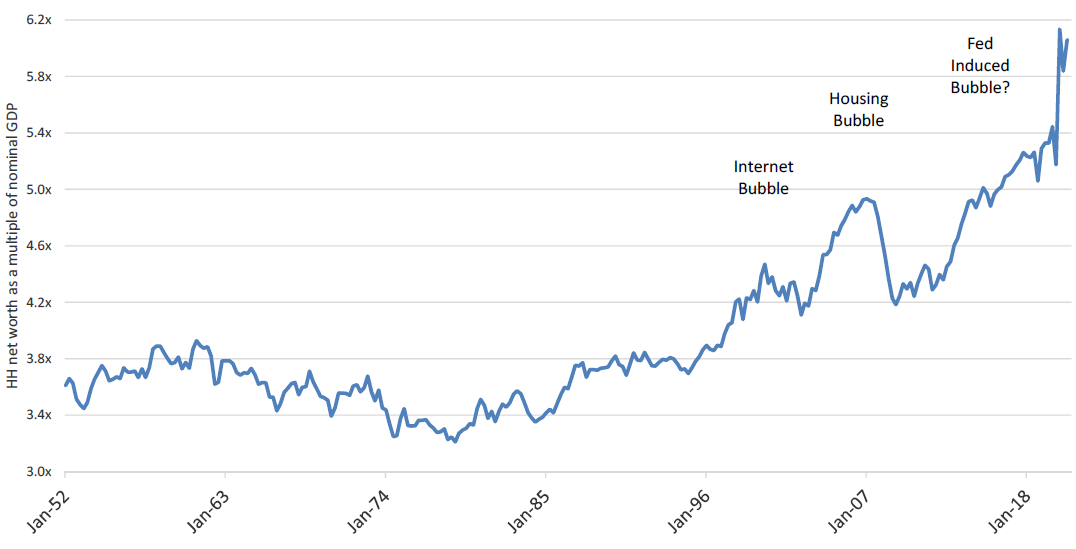
U.S. HOUSEHOLD NET WORTH / NOMINAL GDP
As a Percentage of GDP Household Net Worth is at Record Levels