Two Key Debates for 2023
Senior Portfolio Manager, Justin Anis, walks readers through what was a very challenging quarter for active managers, as markets oscillated between euphoria, panic, and complacency. Lions Bay successfully returned 5.11% this quarter and is preparing for what will be a treacherous summer for stocks.
Performance
For the first quarter of 2023, the Lions Bay fund was up 5.11% while the S&P 500 returned 7.12%. Although our obvious preference would be to outperform each quarter, these results reflect the defensive posture we have adopted in light of our belief that we’re entering a very tenuous phase of the market cycle. Through a discussion of macro trends, this commentary aims to demonstrate to our investors the basis for such conviction.
Lions Bay Business Update
Before diving into the market, we have an important business update. Like in Q1 of last year, when we closed the Founders Class (Class F) to new investors, we will be closing our general class (Class G) indefinitely, effective May 1st. The closure will not affect current investors, unitholders of record as of May 1st will be able to increase and redeem their investment in the Fund. Any existing clients that redeem completely will always be welcomed back into their current class at any point in the future.
Following the successful performance of Lions Bay over the past few years there has been a significant increase in assets under management (“AUM”). Our investment philosophy at Wealhouse focuses on preserving and building wealth for our clients.
We will always prioritize our ability to generate returns over asset growth, and for this reason believe it is prudent to close the Fund to new investors. This will allow us to dedicate our focus on what we do best: research, investing, trading, and providing service to our existing clients.
Quarter in Review
The first quarter of 2023 was very challenging for active managers, as markets oscillated between euphoria, panic, and complacency. The year started with a short squeeze in the biggest losers from 2022, with the Goldman Sachs most shorted index up 19.4% during the month and the Nasdaq up enjoying its best January since 2001, up over 10%. We participated in this move early in the month but underestimated its magnitude and duration.
February brought a brief return to rationality as the Fed maintained a hawkish posture at the February 1st meeting, and investors rotated into cyclicals as bonds sold off, driving yields higher. March brought a banking crisis and the first real sense of panic in some time, with VIX spiking over 40% early in the month as Silicon Valley Bank (SVB) went under. We discussed this incident at length in a prior mid-month update.
This erratic market behaviour was perhaps best observed in bond markets. We have always maintained that interest rates are the most important factor in financial markets, and while the bond market is generally more level-headed than us equity participants, this quarter was an exception.
On February 2nd, the day after the Fed hiked by 25 basis points to a range of 4.75-5.00%, the market was pricing in two more rate hikes before a single rate cut in December. By mid-March, the market was pricing in a rate cut as early as June, and over 3 rate cuts by year end.
These rapidly changing perceptions had a tremendous impact on bond volatility. The U.S. 2-year yield ripped higher after the FOMC meeting, trading above 5% by early March, before retracing the entire move in a handful of days following the SVB failure. We believe early March represented a blow-off top in yields and likely marks the highs of this cycle.
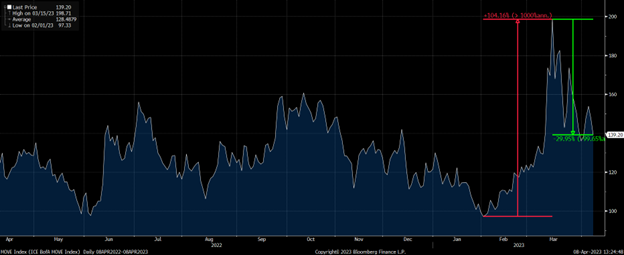
Below, we show the MOVE Index, which is a measure of rate volatility, as well the VIX, which measures equity volatility. You can see that the MOVE Index (traditionally tamer than the VIX) rose over 100% from its early February lows to its March peak, before declining by almost 30% by quarter end. The VIX, meanwhile, spiked “only” 48% before declining over 30% to finish the quarter near its 52-week lows.
MOVE INDEX REPRESENTING VOLATILITY IN FIXED INCOME MARKETS
VIX INDEX REPRESENTING VOLATILITY OF EQUITY MARKETS
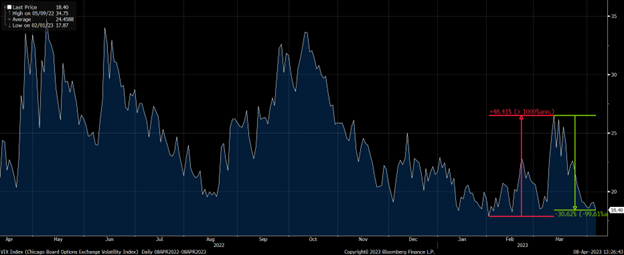
Historically, bond market volatility is a precursor to equity market volatility. We are taking advantage of the subdued price of equity volatility to layer on hedges that will help protect our portfolio from what we anticipate will be a treacherous summer for stocks.
The Two Key Debates for 2023
In our view, there are two key debates that will continue to dominate the year. The first is the question of the timing of a pause or pivot in the hiking cycle. The second, is whether the economy will experience a ‘hard landing’ or ‘soft landing’ at the end of the hiking cycle. We have strong opinions on both.
Pause vs. Pivot
This one is the easier issue: it doesn’t matter. The damage has been done. We believe this debate is analogous to deciding whether to slam on the car brakes 10 feet instead of 5 feet from a brick wall when travelling 150km/h. You’re in for a bad time either way.
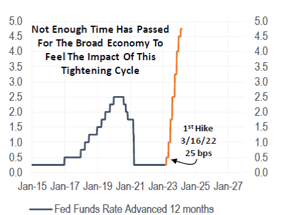
We have only started to feel the impact of this tightening cycle. Interest rate hikes operate with a long and variable lag. Fed hikes historically hit the real economy between 12-24 months from the day of the hike. This is because it takes time for corporations to need refinancing, and fixed rate loans, leases and mortgages to come up for renewal.
The chart below shows just how early we are in the hiking cycle in terms of it impacting the real economy. We only just celebrated the 1-year birthday of the initial rate hike of this cycle, a paltry 25 basis point increase to a 0.5% overnight rate on March 16th, 2022. That means that today, using the bottom end of the historical range of policy lag, the real economy is only digesting a quarter point hike. Over the coming year, the real economy will be hit with the full impact of the fastest rate hike cycle in over 40 years – 400 basis points of tightening in 12 months.
FASTEST RATE HIKE CYCLE IN OVER 40 YEARS
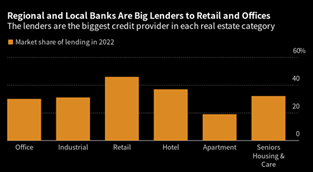
Respecting the long and variable lag of monetary policy, we believe that one of the greatest risks to the economy from this tightening cycle is commercial real estate. Almost $1.5 trillion of commercial real estate debt is coming due before 2025 and will have to be refinanced in an environment of much tighter liquidity and bank lending standards. This is against a backdrop of a commercial real estate sector already facing existential risks on several fronts, with a secular decline in office occupancy rates and a myriad of challenges for bricks-and-mortar retailers.
Morgan Stanley recently estimated that office and retail property valuations could fall as much as 40% peak to trough. This is going to pummel a regional banking sector that is already reeling from the SVB crisis, deposit flight into money market instruments, and the Biden administration seeking to tighten regulation on regional banks. The below chart shows regional lenders are exposures to these end markets.
REGIONAL BANKS LENDING MARKET SHARE BY SECTOR
As noted above, when it comes to monetary policy, the damage has already been done. We plan to tune out the meaningless debates over the next hike or pause that will take place this quarter. Instead, we will dedicate our time to high grading our portfolio to weather the coming recession and take advantage of bear market rallies to add portfolio hedges.
Hard vs. Soft Landing
This is the big one. Financial and even mainstream media has been inundated with references to economic outcomes termed “hard landing”, “soft landing” and even “no landing” (we still have no idea what this means), so we thought it would be important for our readers to understand how we use these terms.
The “landing” describes what happens to the economy at the end of a hiking cycle. Historically, in both soft and hard landings, the bottom of equity markets coincides with a bottom in the housing market.
In addition to defining these terms, we will provide historical analogues of ten prior hiking cycles, as well as the preconditions that have been present in each historical example. Understanding the history of financial markets remains our best tool for navigating the current cycle.
Soft Landings
We define a soft landing as a recession, or end of a hiking cycle, in which a bottom in the housing market occurs and a meaningful deterioration in employment does not. Of the last ten hiking cycles, four ended in soft landings. This phenomenon will be fresh in investors minds, as our most recent hiking cycle occurred in 2018 and ended in a soft landing. Other past soft landings are 1994, 1984 and 1966.
Hard Landings
A hard landing is where the end of a hiking cycle results in a recession and involves a meaningful deterioration in employment, well before housing bottoms. It frequently involves tightening credit markets and an increase in bankruptcies. Six of the last ten hiking cycles resulted in a hard landing.
The most recent hard landing was caused by the 2006 housing market crash, which lead to the global financial crisis in 2008. The lessons from this episode, while almost 15 years old, are still fresh in our memory. It was the last time that markets truly had to reckon with credit risk and respect balance sheet risks. Other examples of hard landings are 2000, 1989, 1980, 1979 and 1974.
Preconditions
Studying these past analogues, we can identify preconditions that were present in each of these examples that distinguish the hard landings from soft landings.
Soft landings featured modest Fed hikes, low inflation (food & energy) and easy bank lending standards. If we look back at the most recent example in 2018, we had no inflation problem – the U.S. PCE for food and energy never exceeded 5%. Bank lending standards for consumer loans, as well as commercial and industrial loans, never went negative. Lastly, we had modest and gradual tightening, as rates were hiked by 225 basis points over a period three years versus 450 basis points over 12 months in our current cycle.
Hard landings were the opposite. They were characterized by rapid Fed hikes, an inflation problem, and tightening lending standards. Looking at the 2006 example, rates were hiked rapidly, with the overnight rate climbing 425 basis points over 25 months. We had an inflation problem, with food and energy prices spiking dramatically in 2007-2008, with crude hitting $150 in the summer of 2008 and wheat prices rising over 170% from early 2006 to 2007. Lastly, bank lending standards experienced the most aggressive tightening since the early 1980s.
How Does Our Current Environment Stack Up?
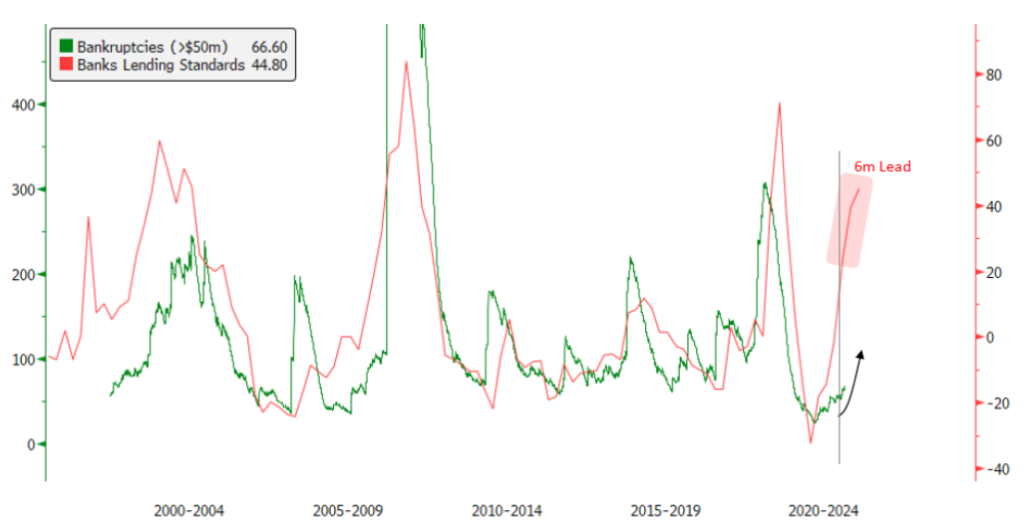
We undeniably started tightening into an inflation spike, the first precondition. Bank lending standards, the second precondition, have tightened the most since 2008 (ex-COVID), and that quarterly data does not yet capture the SVB Financial debacle. We expect a meaningful increase in bankruptcies to follow. The chart below shows the magnitude of tightening in lending standards, advanced six months, against the level of bankruptcies. This will be a tailwind for our investment in Houlihan Lokey.
We recently met with Lindsey Alley, CFO of Houlihan Lokey, in their LA offices. One of the perks of our investment in this company is the ability to talk to management about the behaviour they’re observing in their customers, who are rapidly adapting to the changing market environments. We left the meeting with even more conviction that the commercial real estate market is going to be a problem for years to come – and a great opportunity for Houlihan.
BANK LENDING STANDARDS TIGHTENING, BANKRUPTCIES COMING
Lastly, we’ve had the most rapid tightening cycle since 1980, fulfilling the third precondition. Rates have been hiked by 425 basis points over 12 months, and it is still too soon to definitively call this hiking cycle over. This is nearly double the amount of the tightening in 2018 crammed into 1/3rd the amount of time.
The data simply doesn’t support a soft landing. We expect a rapid rise in unemployment to begin this summer. We listen to what companies are telling us, and across all sectors we are reading about large layoffs. There is a lag to this data as well, as terminated employees receiving severance benefits won’t show up in the data.
We expect equities to hit new lows and housing to take another leg down before bottoming. The market will be on the front page of the newspapers, and today’s optimists calling for a soft-landing will be tomorrow’s pessimists. Our fund is designed to protect the portfolio from this type of environment, and doing so will position us to deploy capital aggressively when the fire sale comes.
There will be an opportunity to make some phenomenal long-term investments with your capital later this year, as incredible values emerge. Until then, our sole focus is protecting your capital.
We wish all our investors a wonderful spring and look forward to updating you again with our Q2 commentary in early July.